You can use the navigation bar to explore the hydrogen atlas and create a customized analysis by selecting parameters and filters.
Click this icon to close all active windows and return to the start page.
Use this icon to select the region that you want to take a closer look at. You can set the spatial resolution, from the whole of Germany down to district level (NUTS 0-3). Click on a region to select or deselect it.
This icon provides you with information on the current status of the German hydrogen economy and its future development. You can display the following plant locations:
Green production
Plants that produce hydrogen or hydrogen by-products such as methane or methanol using green energy
H2 consumption
Industrial plants that consume hydrogen in large quantities
CO2 sources
Plants that emit large quantities of the climate-damaging gas CO2
All systems can be displayed by number or quantity/output. The data is displayed as point data (colored circles).
This icon leads you to the locations of producer and research institutes with a focus on hydrogen and Power-to-X.
This icon shows the potential of renewable energy generation in Germany. You can configure the display individually:
„Power source for electrolysis“
filters the generation types (e.g. photovoltaics or biomass) and shows the potential of this source.
„Electrolysis technology“
shows which process is used to produce hydrogen from green electricity.
As it only makes sense in practice to convert only the electricity that is not directly consumed into hydrogen, you have the option of only displaying the surplus potential under "Calculation basis".
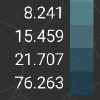
legend
The results are displayed by a correspondingly colored background of the regions.
(legend for the colors: bottom right).
A target year can be set at the bottom of the map (preselection: 2025). All information displayed is in relation to the selected target year if it is time dependent.
This icon at the top right of the map can be used to find cities and regions, as well as plants, manufacturers and research institutes. Click on the search result to display the entry on the map.